Fox News Meteorologist Draws A Giant Dong On Screen During Hurricane Coverage
It's hurricane season - the time of the year when meteorologists get the most airtime on every news outlet across the nation.
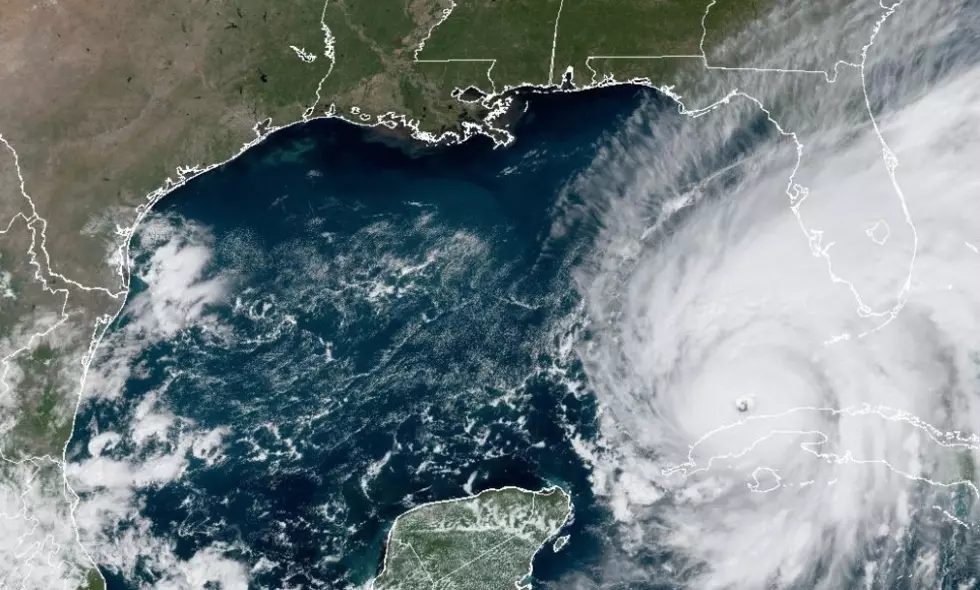
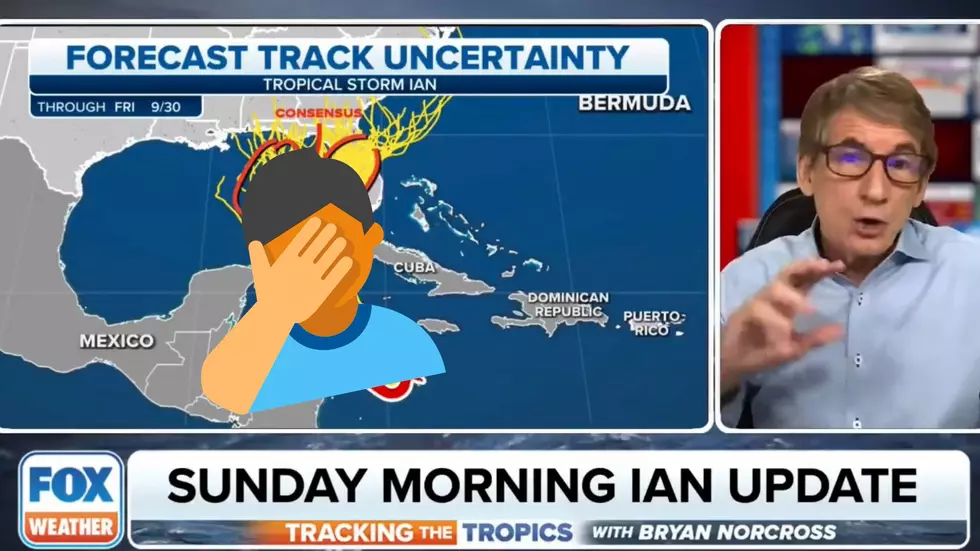
Using the tools at his disposal, Fox News meteorologist Brian Norcross was explaining the path of the hurricane, and where it could possibly turn east or west as it reaches the panhandle.
As he was talking, he drew a circle on the east coast, and one on the gulf side of Florida, resulting in a giant dong drawing on the screen.

He went on to explain that the uncertainty is displayed between the European and GFS models, but you know he noticed what he drew because he stops mid-sentence and turns back to the screen.

Check out the full video here:

Get our free mobile app
LOOK: See how much gasoline cost the year you started driving
To find out more about how has the price of gas changed throughout the years, Stacker ran the numbers on the cost of a gallon of gasoline for each of the last 84 years. Using data from the Bureau of Labor Statistics (released in April 2020), we analyzed the average price for a gallon of unleaded regular gasoline from 1976 to 2020 along with the Consumer Price Index (CPI) for unleaded regular gasoline from 1937 to 1976, including the absolute and inflation-adjusted prices for each year.
Read on to explore the cost of gas over time and rediscover just how much a gallon was when you first started driving.
Gallery Credit: Sophia Crisafulli
More From 97.7 KCRR